In 1954, the supreme court ended segregation of schools. In 1964, congress passed the Civil Rights Act that banned racially segregated accommodations. In 1967, Loving v. Virginia made interracial marriage legal. In 1968, the Fair Housing Act banned housing segregation (Head 2018). Many people today believe that segregation is no longer a problem. People go to school, work and the grocery store and see people of multiple different backgrounds. However, housing and education segregation is still a severe issue. During my Introduction to Social Problems course, we reviewed a map from the 2010 census that marked where people of different races resided. A blue dot was signified for Whites, green for Blacks, red for Asians, and orange for Hispanics. The most prominent segregation was found in large cities like Chicago and Detroit. You can see clear definition of African Americans and Hispanics in the inner city and whites surrounding them. Little to no blue dots were seen in the inner city. Asians mostly were dispersed through white communities and sometimes found in very small cluster in the inner city (Cable 2013).
I searched for the city I grew up in, Clover, SC. In this predominantly white, very southern city, everyone knows were the line is between black and whites. I was able to confirm once I saw this map. Segregation is closely associated with class and wealth. In the United States, areas with lower income contain mostly African Americans and Hispanics and areas of higher income contain mostly whites. Clover is right on the border between North and South Carolina and a physical lake divides the two. On the South Carolina side of the lake, it was an expanse of blue dots and on the Charlotte, NC side, the spots were very mixed. Living near or on the lake is more expensive than living further from the lake, therefore the blue spots were surrounding the lake on the Clover side. The area of Charlotte that is across the lake has a large mix of classes, therefore more diversity is seen.
I searched for the city I grew up in, Clover, SC. In this predominantly white, very southern city, everyone knows were the line is between black and whites. I was able to confirm once I saw this map. Segregation is closely associated with class and wealth. In the United States, areas with lower income contain mostly African Americans and Hispanics and areas of higher income contain mostly whites. Clover is right on the border between North and South Carolina and a physical lake divides the two. On the South Carolina side of the lake, it was an expanse of blue dots and on the Charlotte, NC side, the spots were very mixed. Living near or on the lake is more expensive than living further from the lake, therefore the blue spots were surrounding the lake on the Clover side. The area of Charlotte that is across the lake has a large mix of classes, therefore more diversity is seen.
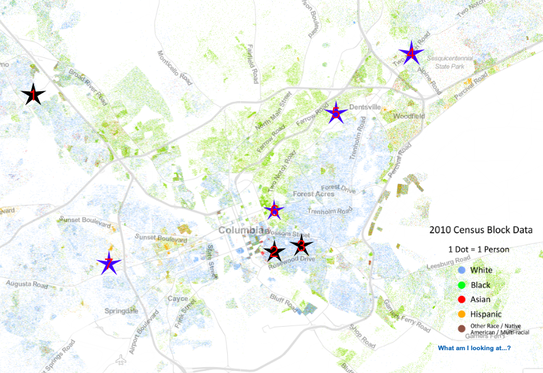 This is the map of Columbia with each service site listed that I went to during Service Saturday. The black stars indicate the sites in the higher income areas and the blue stars indicate the sites in lower income areas. 1. Pawmetto Lifeline 2. Sustainable Midlands 3. Belser Arboretum 4. Oliver Gospel Thrift Store 5. God's Storehouse 6. Salvation Army 7. Habitat for Humanity
I found Columbia on the map which showed clear segregation between the different parts of the community. I then decided to find each of the service sites that I go to as a Service Saturday Site Leader on the map. There was a clear difference in location depending on the type of site. Sites like Salvation Army, Oliver Gospel Mission, God’s Storehouse and Habitat for Humanity are in areas that are heavily spotted either green or orange. Sites like Pawmetto Lifeline, Belser Arboretum, and Sustainable Midlands are in areas with a higher concentration of blue. The sites with high concentrations of minorities are the sites that focus on providing services and items for lower income individuals and are in low income areas. At these sites, I have tasks such as sorting through donations or organizing food pantries. The sites that are in the higher income areas with high concentrations of the majority focus on caring for animals or making the community more environmentally sustainable. This shows that segregation is a true social problem that is often overlooked. When you dive deeper into segregation, you see problems that are individualized to each group, which can be a social issue itself. In the higher income areas, people are worried about social problems like environmental issues. I have picked up bags and bags of garbage during trash clean up in neighborhoods around USC. At Belser, I have helped preserve a beautiful piece of land that has many thriving ecosystems while the areas around it are being destroyed by the building of homes and businesses. In lower income areas, people are concerned with having clothes to wear, food to eat and houses to live in.
After each Service Saturday, I ask my group a series of questions that allow them to reflect on their service. The questions focus on the impact they had on the site director and the surrounding community as well as a reflection of their specific tasks. This allows them to look deeper into their service and see what areas they are working in compared to where they are from or other sites they have worked in. I have attached a list of example questions that I have asked after one Service Saturday (example_ss_question.docx, . Below is a slideshow of photos groups I have brought to different service sites.
We should not turn a blind eye to segregation in the United States. Segregation is still real. These separate lines do not have equal opportunities or similar problems. Even though the U.S. has made very meaningful advances against segregation, I hope my generation will continue the strides so that our map can become a beautiful mixture of all races and ethnicities with no dividing lines.
We should not turn a blind eye to segregation in the United States. Segregation is still real. These separate lines do not have equal opportunities or similar problems. Even though the U.S. has made very meaningful advances against segregation, I hope my generation will continue the strides so that our map can become a beautiful mixture of all races and ethnicities with no dividing lines.
Citations:
1. Cable, D. (2013). The Racial Dot Map. Retrieved from https://demographics.virginia.edu/DotMap/
2. Head, T. (2018). When Did Segregation End in the United States? A Time Line. Retrieved from https://www.thoughtco.com/desegregation-in-the-united-states-721609
1. Cable, D. (2013). The Racial Dot Map. Retrieved from https://demographics.virginia.edu/DotMap/
2. Head, T. (2018). When Did Segregation End in the United States? A Time Line. Retrieved from https://www.thoughtco.com/desegregation-in-the-united-states-721609
